
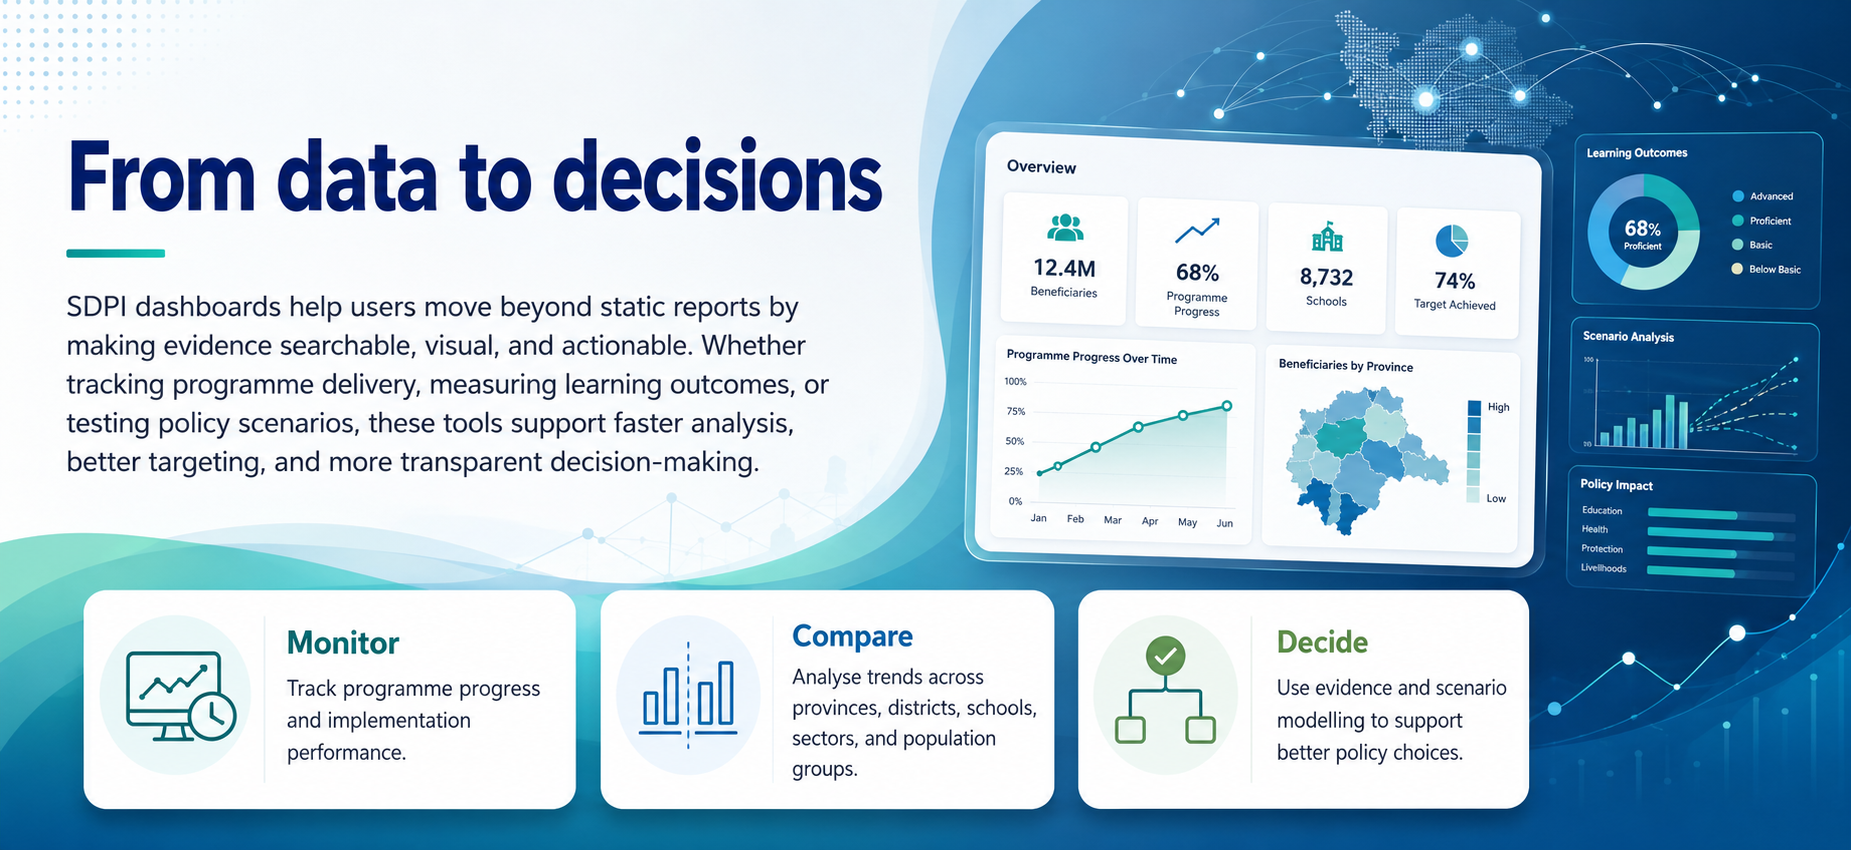
SDPI’s data dashboards translate complex development challenges into clear, interactive, and decision-ready insights. Designed for policymakers, programme teams, researchers, donors, and implementation partners, these dashboards bring together real-time monitoring, field evidence, geospatial coverage, and performance indicators in one accessible platform. They support evidence-based planning, adaptive programming, accountability, and transparent reporting across SDPI’s research and policy work.
The ILMpact Dashboards are SDPI’s central digital monitoring and learning platform for tracking progress under the FCDO-funded “Girls and Out-of-School Children: Action for Learning” programme, led by the British Council consortium. Covering 15 districts across Punjab and Khyber Pakhtunkhwa, the dashboards provide a data-driven view of programme performance, beneficiary outreach, school-level progress, and key education indicators.
The dashboards support real-time monitoring of the programme’s ambition to improve learning outcomes for 160,000 students, including 64,000 out-of-school children. They enable secure tracking of beneficiaries from enrolment through the programme cycle, while visualising progress on foundational literacy and numeracy, school participation, gender inclusion, disability inclusion, teacher training, and institutional strengthening.
As the Monitoring, Evaluation and Learning lead, SDPI uses the dashboards to strengthen data quality, support adaptive decision-making, identify implementation gaps, and generate timely evidence for programme partners and government stakeholders.
By combining field monitoring, baseline evidence, KPI tracking, and structured reporting, the ILMpact Dashboards transform programme data into actionable intelligence for improving access, inclusion, and learning outcomes for marginalised children.
The ILMpact CLP Dashboard provides an interactive view of student learning progress across Urdu, English, and Math, enabling SDPI and programme partners to track improvement from baseline to endline, compare performance by geography, partner, school, teacher, and gender, and identify areas requiring targeted academic and implementation support.
It is designed to track how students are progressing across baseline, midline, and endline assessments, especially in Urdu, English, and Math. The dashboard includes filters for province, partner, district, tehsil, school, gender, assessment stage, and overall status, which suggests it can be used to drill down from provincial-level trends to school- or student-level performance.
It shows:
Student learning progress: It tracks average score progression from baseline to midline to endline, helping show whether students improved, declined, stayed the same, or have missing data.
Subject-wise performance: It separately visualises learning levels and performance in Urdu, English, and Math, including subject donuts, level distributions, and subject status comparisons.
Geographic and partner comparisons: It includes district improvement rates, province comparison, partner performance, and district ranking, which means it can help identify where the programme is performing strongly and where support may be needed.
Equity and inclusion lens: The presence of a gender comparison filter/chart suggests the dashboard can examine whether learning gains differ by gender.
School and teacher performance insights: It shows Top 10 Schools — Improvement, Bottom 10 Schools — Highest Decline, and Top Teachers.
Assessment coverage and data quality: It includes assessment coverage for baseline, midline, and endline counts, plus filters such as “complete records only” and “has endline data.”
© 2026 SDPI. All Rights Reserved Designed and developed by NKMIS WEB Unit